“Numerology” tries to find reality within various measurements of economic and real estate trends.
Buzz: If buying a home “works out over time” – how long must you wait so a purchase isn’t a money-loser?
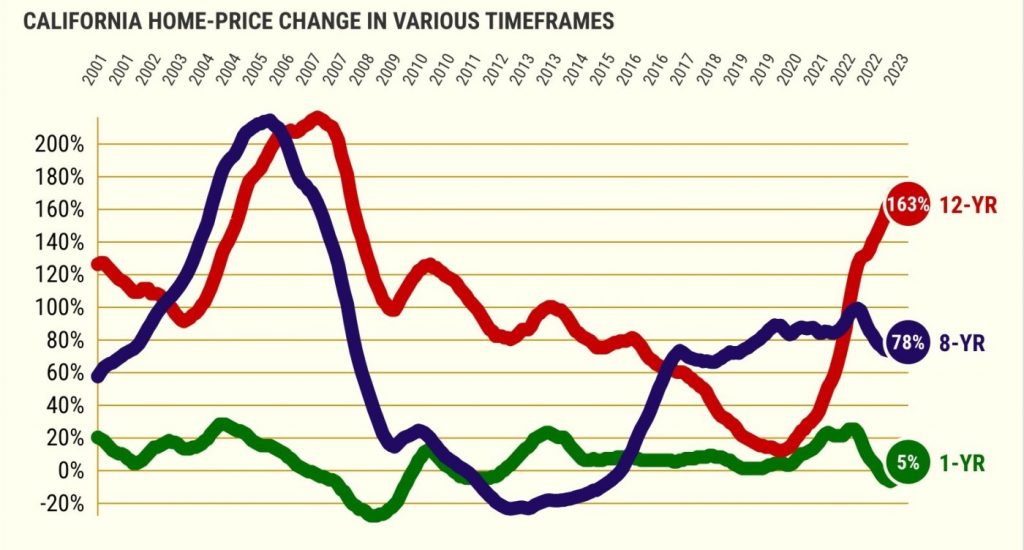
Source: My trusty spreadsheet was filled with Case-Shiller home-price indexes for Los Angeles-Orange County, San Francisco, and San Diego dating to 1987 – with an average of this trio’s performance used as a benchmark for California housing values. Case-Shiller’s US index was tracked as well.
Fuzzy math: History says owning a home for at least 12 years yielded loss-free results.
Top Line
Related Articles
San Jose wins back housing at Berryessa flea market site
Residents ponder prospect of thousands of homes at San Jose golf site
California landlords wanted the Supreme Court to limit rent control laws. They won’t — for now
Mini golf venue could bolster downtown San Jose economy
Huge new Cupertino neighborhood slated to rise atop old mall gets city OK
The assumption was “works out over time” translates to no price declines in a given period. Let me start by using one-year ownership as an example.
California prices fell in 30% of the 12-month periods since 1987. Now owning one year did produce an average 6% gain – ranging from a 28% loss in 2008 to a 28% gain in 2004.
And, by the way, US homes were down in just 18% of 1-year periods.
So clearly one year isn’t enough of an ownership length to be a “risk-free” purchase.
Nitty Gritty
I won’t bore you with every year’s worth of results, so I’ll just fast-forward to what happened with four years of ownership.
Since 1987, owning a California home for 48 months had 27% losing periods. Not much of an improvement.
The average 4-year result was a 27% gain.– ranging from a 38% drop through 2009 to a 94% surge through 2006. US homes had 13% down 4-year periods.
Next, look at 8-year ownership. History shows 21% losing periods but an average gain of 61% – ranging from a 24% tumble through 2012 to a 214% upswing through 2005. US homes had 14% down 8-year periods.
Even owning for a decade wasn’t risk-free since 1987. Over 10 years, there were still 9% losers – though the average result was an 80% gain. Worst was down 7% through 2016. Best was up 250% through 2006. US homes had 5% down 10-year periods.
A Californian had to own for 12 years to have no declining periods since 1987. The average gain was 94% – ranging from up 6% through 2017 to up 240% through 2006. US homes, too, had no down 12-year periods.
Bottom line
One could argue that the future won’t look like the past 36 years that featured a horrific market crash of the 2000s and housing malaise that ran for much of the 1990s. The purported shortage of housing might limit the odds of such home-price calamities.
Conversely, the next 35 years will unlikely see home-price drivers such as stunning California growth – economically or population-wise – or mortgage rates going from double-digits to under 3%.
Yes, past performance is no guarantee of future returns. But those who ignore history often learn tough lessons.
PS: When I used the California Association of Realtors’ median home price, dating to 1990, for the same math it took 14 years for risk-free ownership. Average gain was 90% ranging from a 4% gain through 2020 to a 221% surge through 2023.
Jonathan Lansner is business columnist for the Southern California News Group. He can be reached at [email protected]


