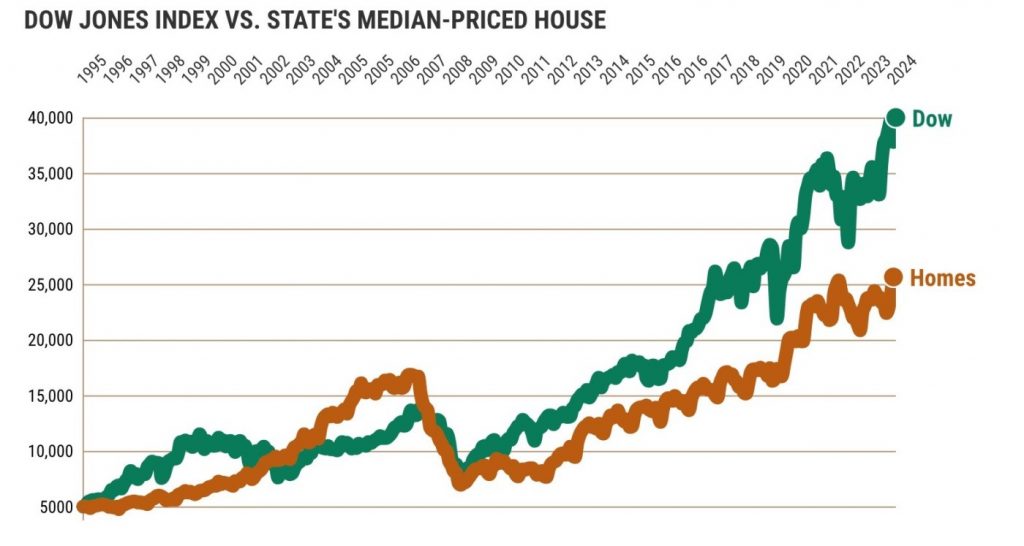
The stock market’s venerable yardstick, the Dow Jones Industrial Average, just made history – crossing 40,000 for the first time.
Yes, this milestone set Thursday, May 16, is only a brief emotional victory for shareholders. Yet it can be seen as a historical milepost for the broader business climate, especially in California.
To honor the moment, the trusty spreadsheet reviewed the Dow’s 5,000-point markers and how California fared in those periods using an economic metric (California unemployment), an interest rate (the average 30-year fixed mortgage), and home prices from the California Association of Realtors.
As we begin our data-filled voyage, let’s note the Dow first crossed 5,000 in November 1995 — back when you could buy the median-priced California single-family home for $176,000.
5,000-point mileposts
Dow passes 10,000 in December 1999: It took the stock index just over four years to double from 5,000 compared with a 28% gain for California homes to $225,000 in the same timeframe. This was an era when the economy broke loose from its early 1990s slumber. California unemployment dipped between 1995 and 1999 to 5% from 7.9% while mortgage rates rose to 7.9% from 7.4%.
15,000 in May 2013: The Dow needed more than 13 years to gain 50% to hit this benchmark vs. an 85% surge for homes statewide to $417,000 in the same period. This extended gap came during the financial rollercoaster ride from the bubble period in the early 2000s bursting into a Great Recession and then the economy’s slow recovery. So, California unemployment was 9.2%, up from 5% at the beginning of this crazy period. Yet, cheap money was one salve: 3.5% mortgages vs. 7.9% in 1999.
20,000 in January 2017: The Dow took under four years to gain 33% to gain the next 5,000 while homes statewide gained 18% to $492,000 as the post-crash rebound continued. California unemployment fell to 5.2% from 9.2% as mortgage rates ticked up to 4.2% from 3.5% in 2013.
25,000 in January 2018: The Dow needed just one year to gain 25% for its next benchmark vs. a 7% gain for California homes to $528,000 as the recovery hit full stride. California unemployment dipped to 4.4% from 5.2% while mortgage rates slipped to 4% from 4.2% in 2017.
30,000 in November 2020: The index took just under three years to gain 20% vs. 32% for California homes to $699,000 in the middle of the pandemic’s business wild gyrations. California unemployment surged to 9% from 4.4% – but investors cheered historically cheap money such as mortgages hitting 2.8%, falling from 4% in 2018.
35,000 in July 2021: It took the Dow less than a year to gain 17% vs. 16% appreciation for California homes to $811,000 as the pandemic’s economic surge was in full force. Statewide unemployment fell to 7.4% from 9% and mortgages remained cheap – 2.9% vs. 2.8% in 2020.
40,000 in May 2024: The Dow took almost three years to gain 14% vs. an 11% gain for California homes to a record $904,000 in April. The economy struggles to find its new normal as statewide unemployment fell to 5.3% in April from 7.4%. But mortgages got expensive as the Federal Reserve fought and overheated economy – 7% in April from 2.9% in 2021.
Bottom line
So, the Dow is up eight-fold since crossing 5,000 just over 28 years ago. California homes are only five times more expensive.
That’s not the point, though. This stroll down memory lane reminds us that the markets typically need a solid economy for stocks or homes to appreciate. Cheap money is the icing on the cake.
Jonathan Lansner is the business columnist for the Southern California News Group. He can be reached at [email protected]
Related Articles
Bay Area and California add jobs in April — but the gains are puny
‘Experience economy’ may bolster post-COVID downtown San Jose recovery
Big San Jose housing project advances with property purchase deal
After Dow briefly tops 40,000 for first time, Wall Street edges back from record
Krugman: Preparing for the dangers of a second China shock


